
Summary
- Snowflake’s Vino Duraisamy and Replit’s Manny Bernabe return to turn simple dashboards into working data tools.
- Live forecasting and drilldowns explain why metrics move, not just what changed on your Snowflake dashboard.
- Custom Slack alerts fire when revenue crosses key thresholds so teams catch spikes, drops, and odd days quickly.
- An embedded AI data assistant answers plain-English questions and shows the exact SQL it ran for every query.
- Replit handles security scanning, auth, and hosting so you can ship Snowflake-powered data apps in minutes.
Introduction
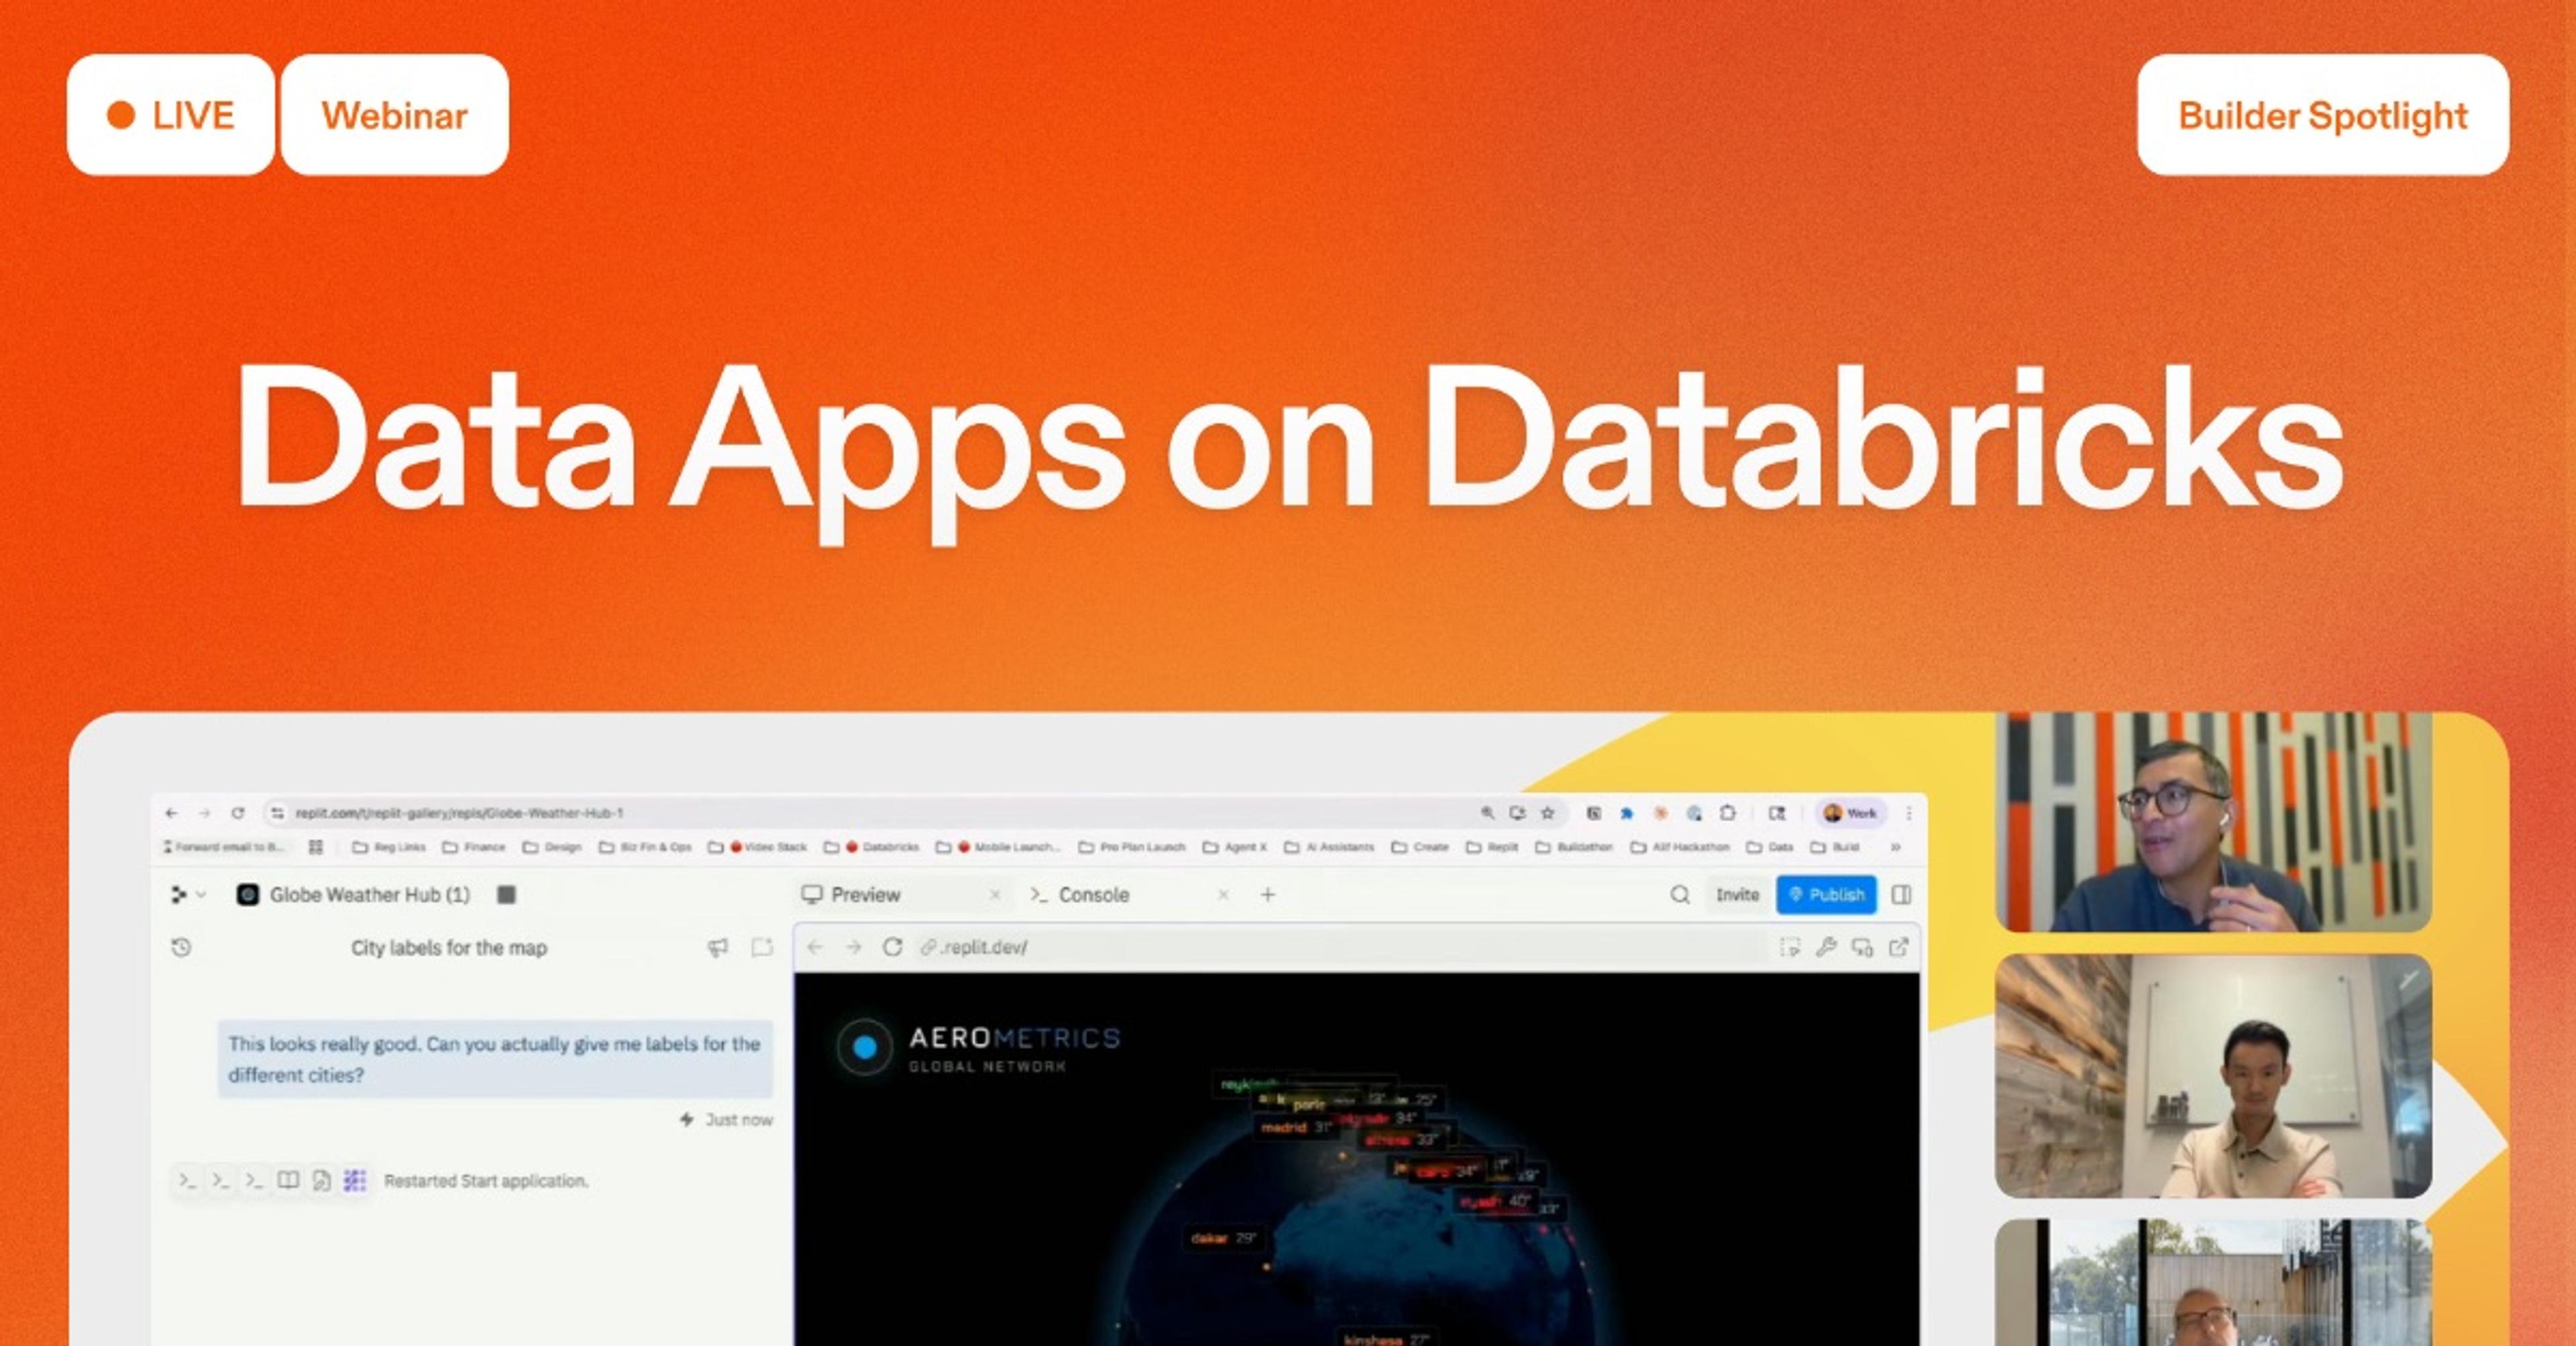
In Part 1, Vino Duraisamy, Developer Advocate from Snowflake, and Replit Community Manny Bernabe, showed how to build a live dashboard in minutes. No hand-written SQL. No front-end headaches. If you missed it, check out the recap: Vibe Code Data Apps with Replit + Snowflake.
Now, in Part 2, they keep going.
No more stopping at just “pretty charts.” Manny and Vino build on the same Snowflake dataset. They add forecasting, detailed drilldowns, a Slack alert system, and an assistant that handles natural-language questions and shows the SQL behind each answer.
Manny sums it up:
“You communicate with AI using natural language, and you guide AI in terms of what you want to build rather than having to write the code yourself.”
This session covers what happens after the dashboard is live. How do you turn it into a tool your team can actually use to make decisions?
From dashboards to decision hubs
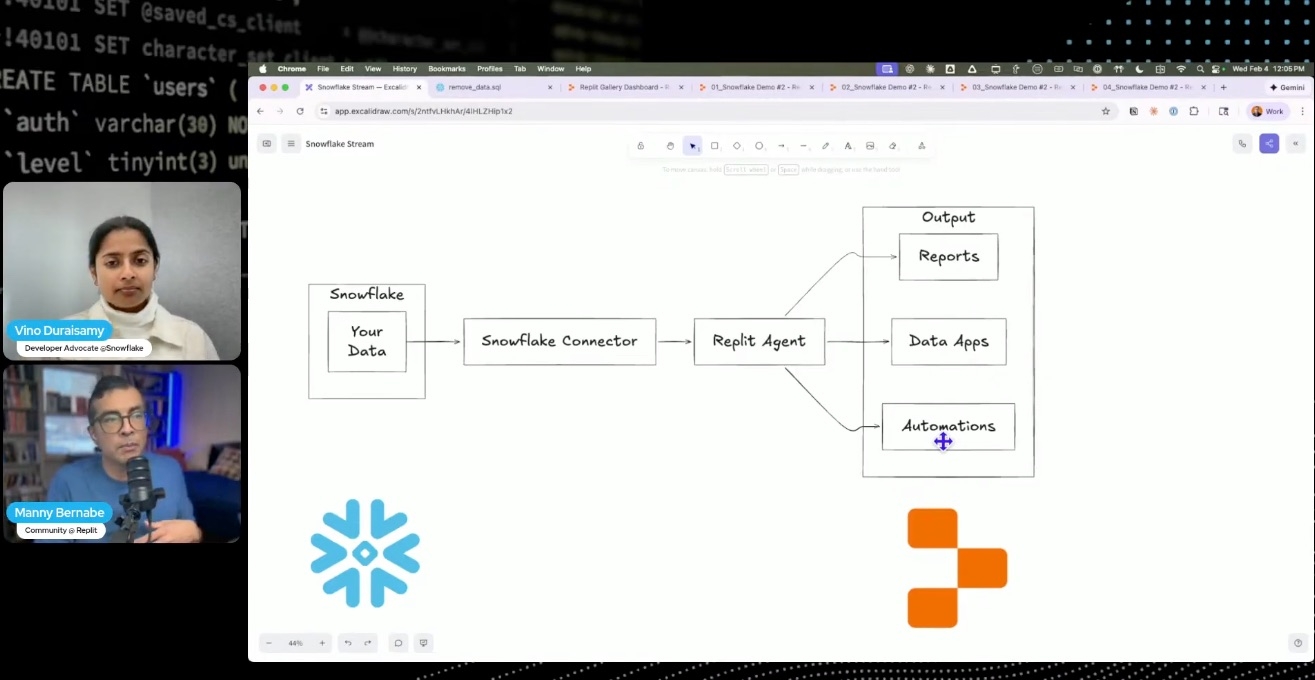
Manny gives a quick recap of the Part 1 build: a live sales dashboard powered by the Replit–Snowflake connector.
Manny describes Snowflake as an end-to-end data and AI platform for prepping, engineering, wrangling, and modeling. Replit connects through a secure connector that respects Snowflake’s role-based access control. Once it’s set up, Replit Agent can see datasets, run queries in Snowflake, and stream results into the app.
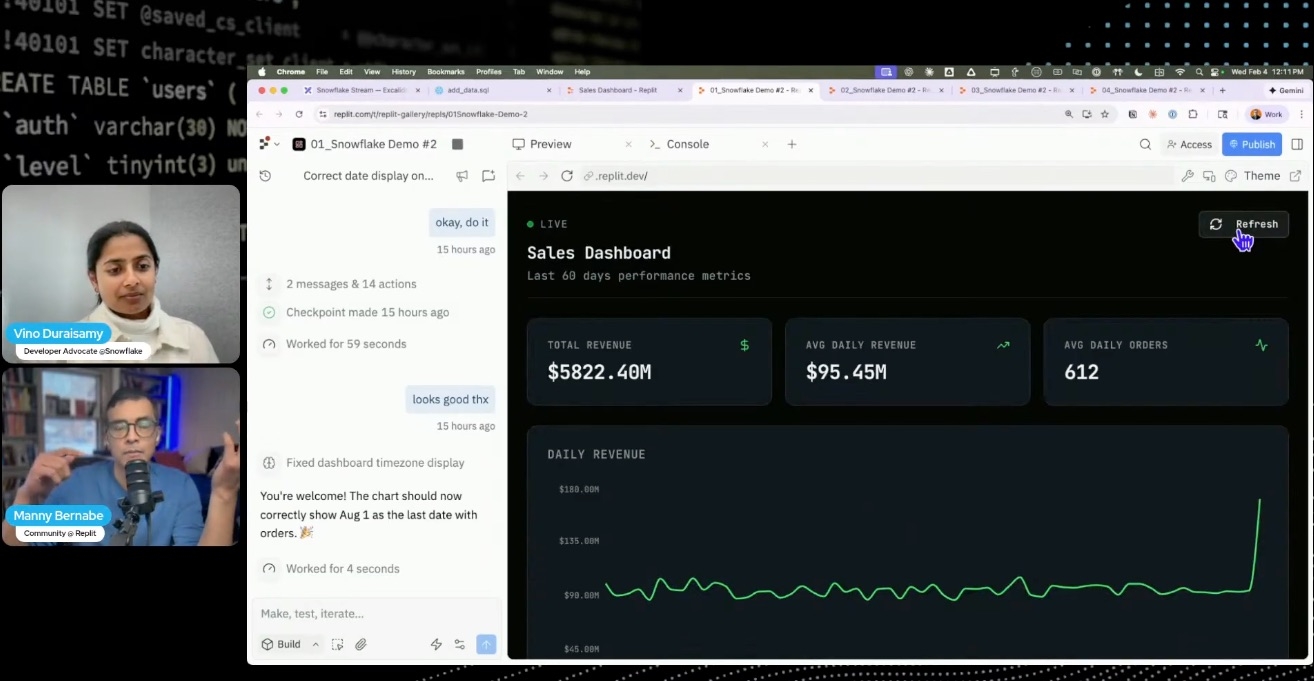
To rebuild the dashboard, Manny drops a plain-English prompt into Replit:
“I’m asking Replit to build a sales dashboard that has daily tracking that’s looking at revenue for the last sixty days.”
He adds a quick style note too, something like a dark, finance-terminal look. Agent does the rest:
- Sets up the app and file structure
- Activates the Snowflake connector with a slash command
- Generates SQL to pull and sum sales data
- Wires everything into a chart with KPI cards
In about 10–15 minutes, Agent finishes. They have a working dashboard, live on Snowflake data. No local setup. No manual charting.
This is where Part 2 really kicks off.
Forecast the future of your revenue
Seeing yesterday’s revenue is fine. Seeing where you’re headed is better.
Manny asks Replit Agent to extend the app:
“Add a forecast line that predicts revenue for the next fifteen days.”
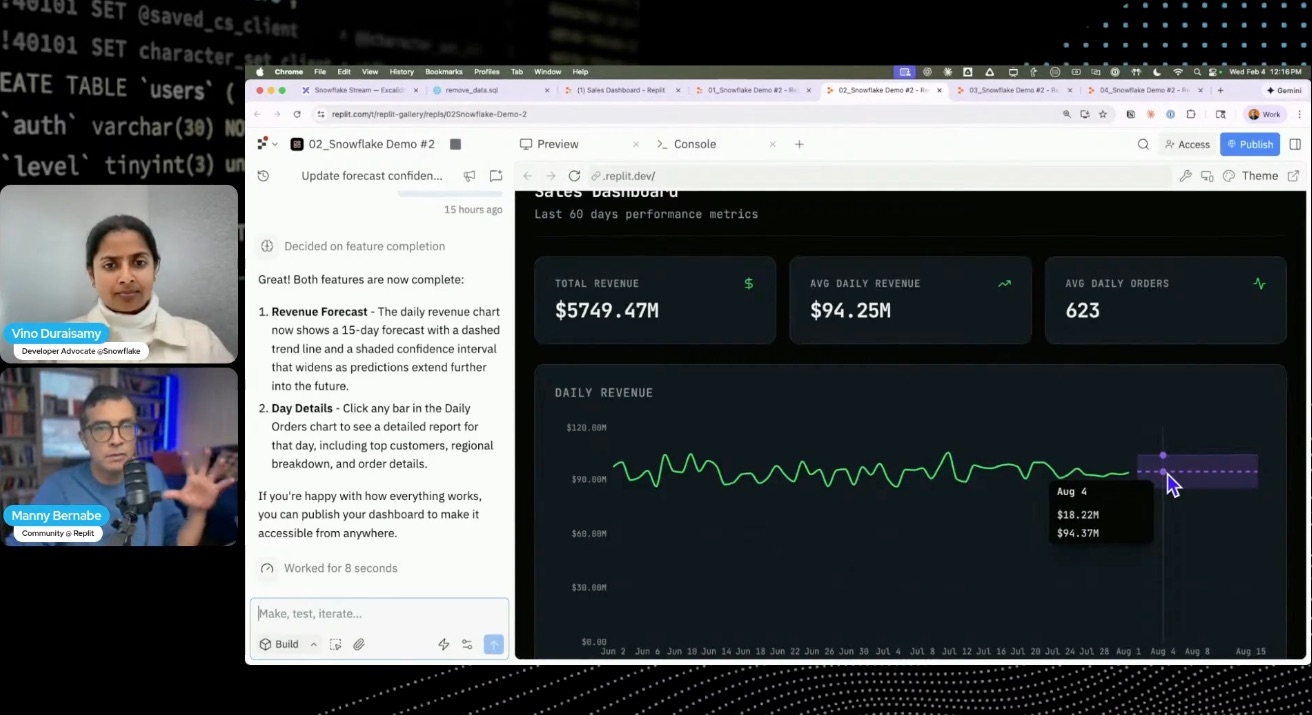
Agent updates the project to:
- Run a time-series forecast on recent sales
- Draw a new line for projected revenue
- Show a band for the likely range
Now the dashboard answers more than just “What happened?” It also answers:
- Are we on track for this quarter’s target?
- What happens if the current trend keeps up?
If you’re technical, you can ask Agent to try different forecast models, include seasonality, or log its choices. If not, you still get a clear look at where the business is headed. No code needed.
Drill into the “why” behind every spike
A chart tells you something changed, but not why.
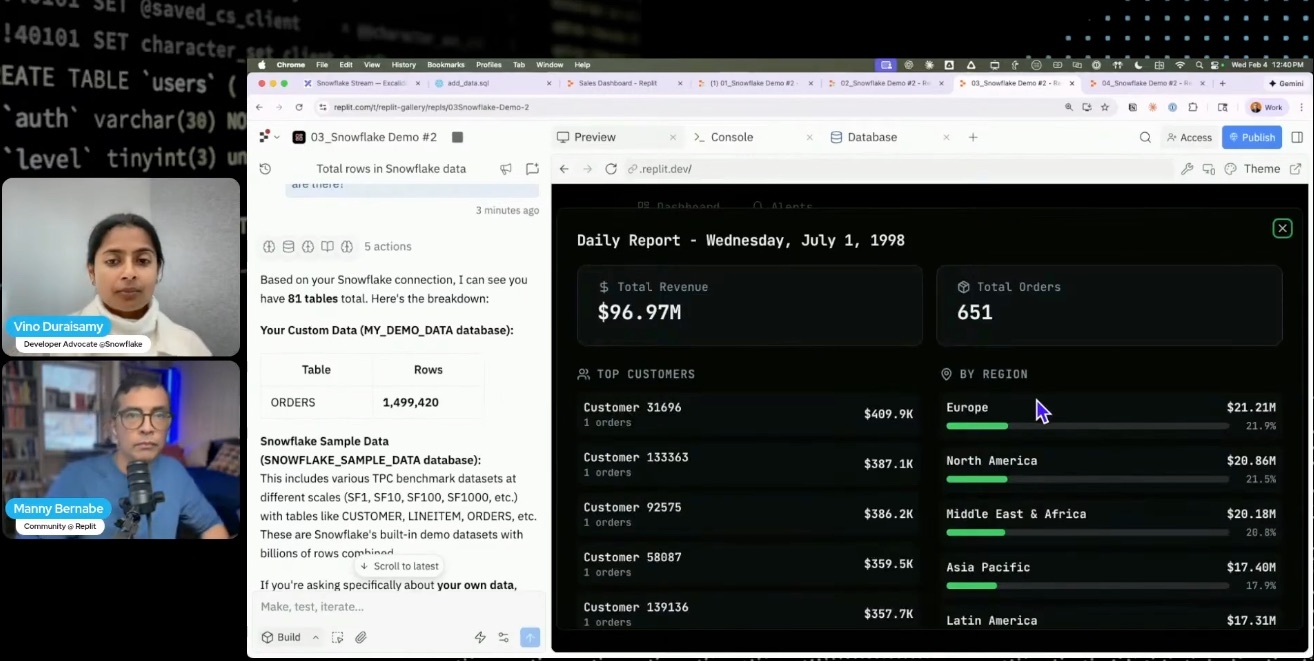
Manny asks Agent to add deeper drilldowns. When revenue jumps or drops, you can click through to see:
- Which regions or segments made the biggest difference
- How certain products did in the same period
- If just a few big customers changed the trend
In the webinar, Manny and Vino show examples: drilling into a spike, using filters and detail views to spot what caused it. The app shifts from static report to a surface you can explore.
All of this runs on plain-English prompts to Replit Agent. Want a new view? Just describe it and Agent writes the code and SQL.
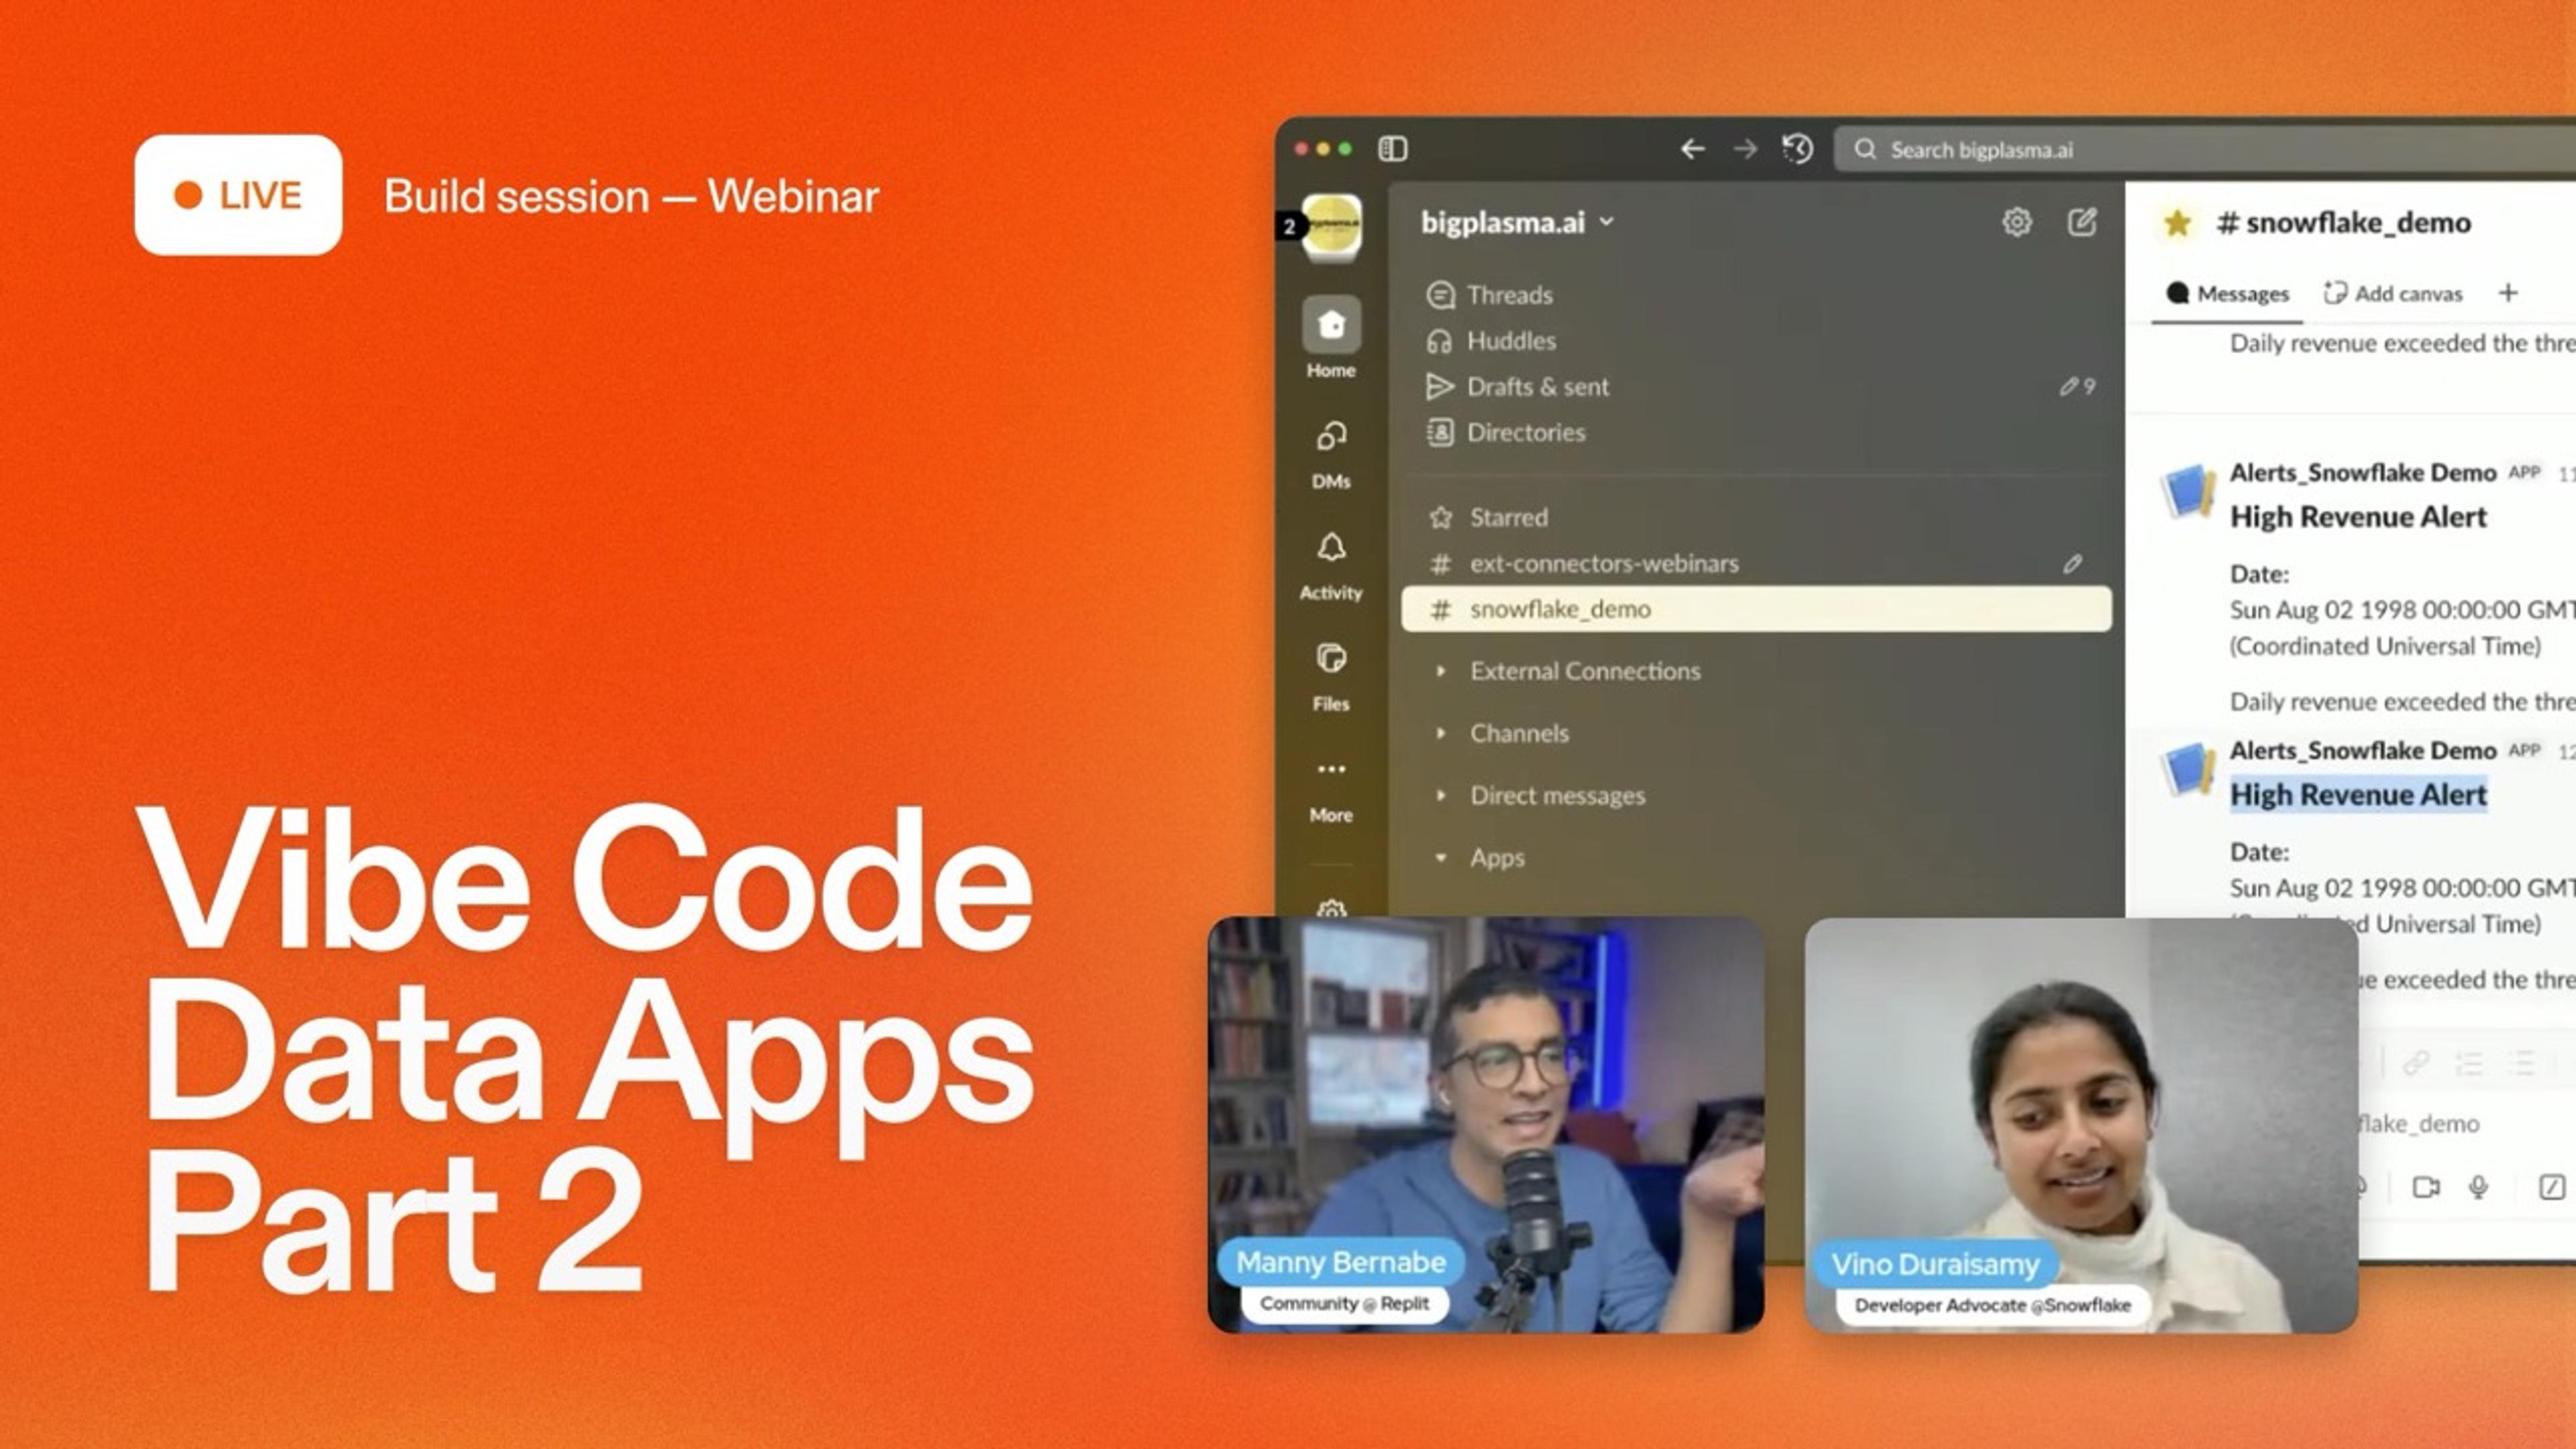
Get ahead of changes with Slack alerts
Dashboards are only helpful if someone’s watching. But most of us aren’t staring at metrics all day.
Manny has Agent add a Slack alerting layer. The idea: ping the right channel when key numbers cross a line.
He prompts Agent to:
- Watch daily revenue and other metrics for spikes, drops, or outliers
- Set rules like “if revenue falls below X” or “if signups jump above Y”
- Post alerts to Slack with the details and a link back to the app
This makes the dashboard a lightweight monitoring tool. No more checking numbers every morning. Your team gets pinged when something actually needs attention. A sudden dip, a spike, a weird trend.
Since the app runs on Replit, you don’t need to build separate cron jobs or alerting tools. It’s all in one place.
Add an embedded AI data assistant
The last big upgrade is an assistant that sits next to the dashboard.
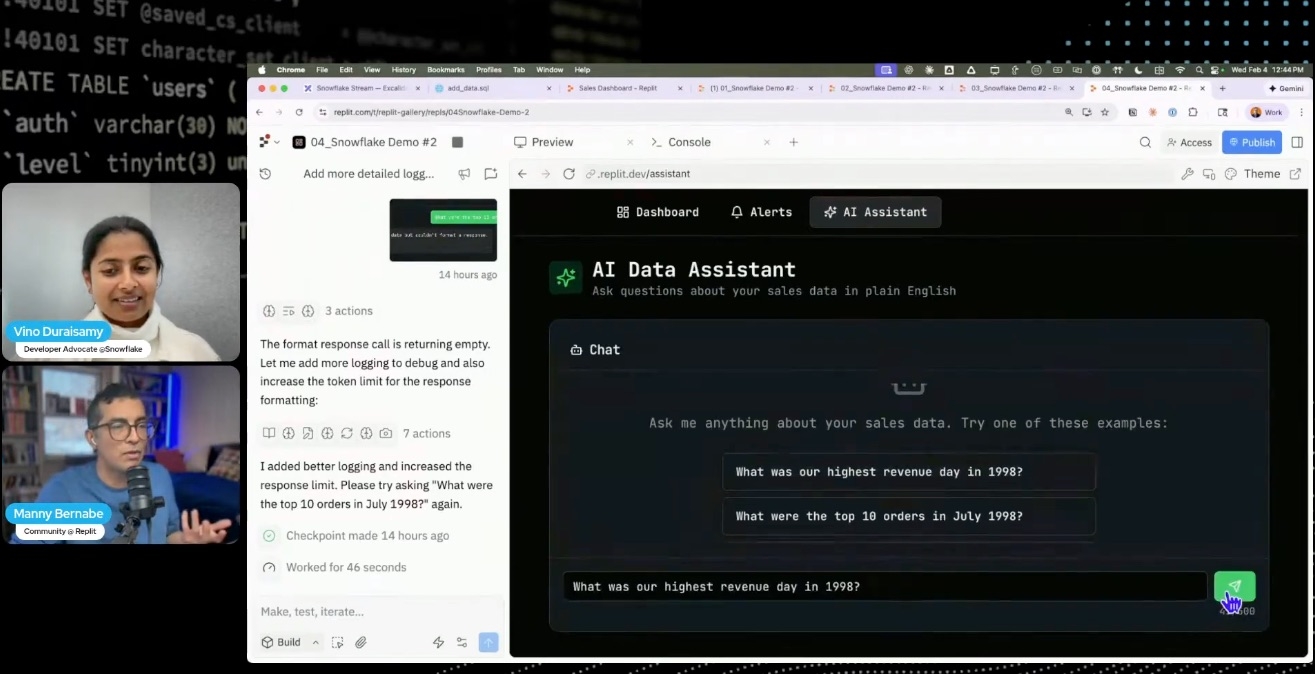
Manny and Vino show how to:
- Give Replit Agent safe, read-only access to Snowflake tables
- Let users ask questions about their data in plain English
- Show both the answer and the exact SQL the assistant used
For example, someone on the team can type a question like:
“What were our top five regions by revenue last quarter?”
The assistant writes the query, runs it in Snowflake, and returns both the answer and the SQL. Data teams can check the code; non-technical folks get answers fast.
Because it all runs inside a Replit app, you can keep tweaking the prompts, UI, and safeguards over time. No need to rebuild from scratch.
Ship Snowflake‑powered apps safely on Replit
All of this relies on the Snowflake connector and Replit’s secure deployment flow.
Vino highlights Snowflake’s role-based controls and how the connector respects those. Admins pick what Replit can see. Apps stay inside those limits.
On the Replit side, publishing the app triggers:
- Security scan for common vulnerabilities
- Authentication and environment variable setup
- Hosting on Replit with a shareable URL
Bottom line: you get a real data app, powered by Snowflake and Replit, with no extra plumbing.
Where vibe‑coded data apps go next
Part 2 shows what everyday analytics can look like when the tooling gets out of the way:
- Dashboards that show where you’re headed
- Drilldowns that reveal why things changed
- Alerts that tap you on the shoulder when something happens
- An assistant that makes Snowflake data easy for the whole team
If Part 1 was about getting to a working dashboard fast, Part 2 is about making that dashboard something your business can actually use.
Additional Resources
- If you want to try vibe coding your own Snowflake-powered data apps, check out the Replit–Snowflake connector and try Replit Agent with your own data.
- Set-up guide for connecting Snowflake and Replit