To make it so that anyone with a web browser can code on Replit, our backend infrastructures runs on preemptible VMs. That means the computer running your code can shutdown at any time! We've made it really fast for repls to reconnect when that happens. Despite our best efforts, though, people had been seeing repls stuck connecting for a long time. After some profiling and digging into the Docker source code, we found and fixed the problem. Our session connection error rate dropped from 3% to under 0.5% and our 99th percentile session boot time dropped from 2 minutes to 15 seconds.
There were many different causes of stuck repls, varying from: unhealthy machines, race conditions that lead to deadlock, and slow container shutdowns. This post focuses how we fixed the last cause, slow container shutdowns. Slow container shutdowns affected nearly everyone using the platform and would cause a repl to be inaccesible for up to a minute.
Replit Architecture
Before going in depth on fixing slow container shutdowns, you'll need some knowledge of Replit's architecture.
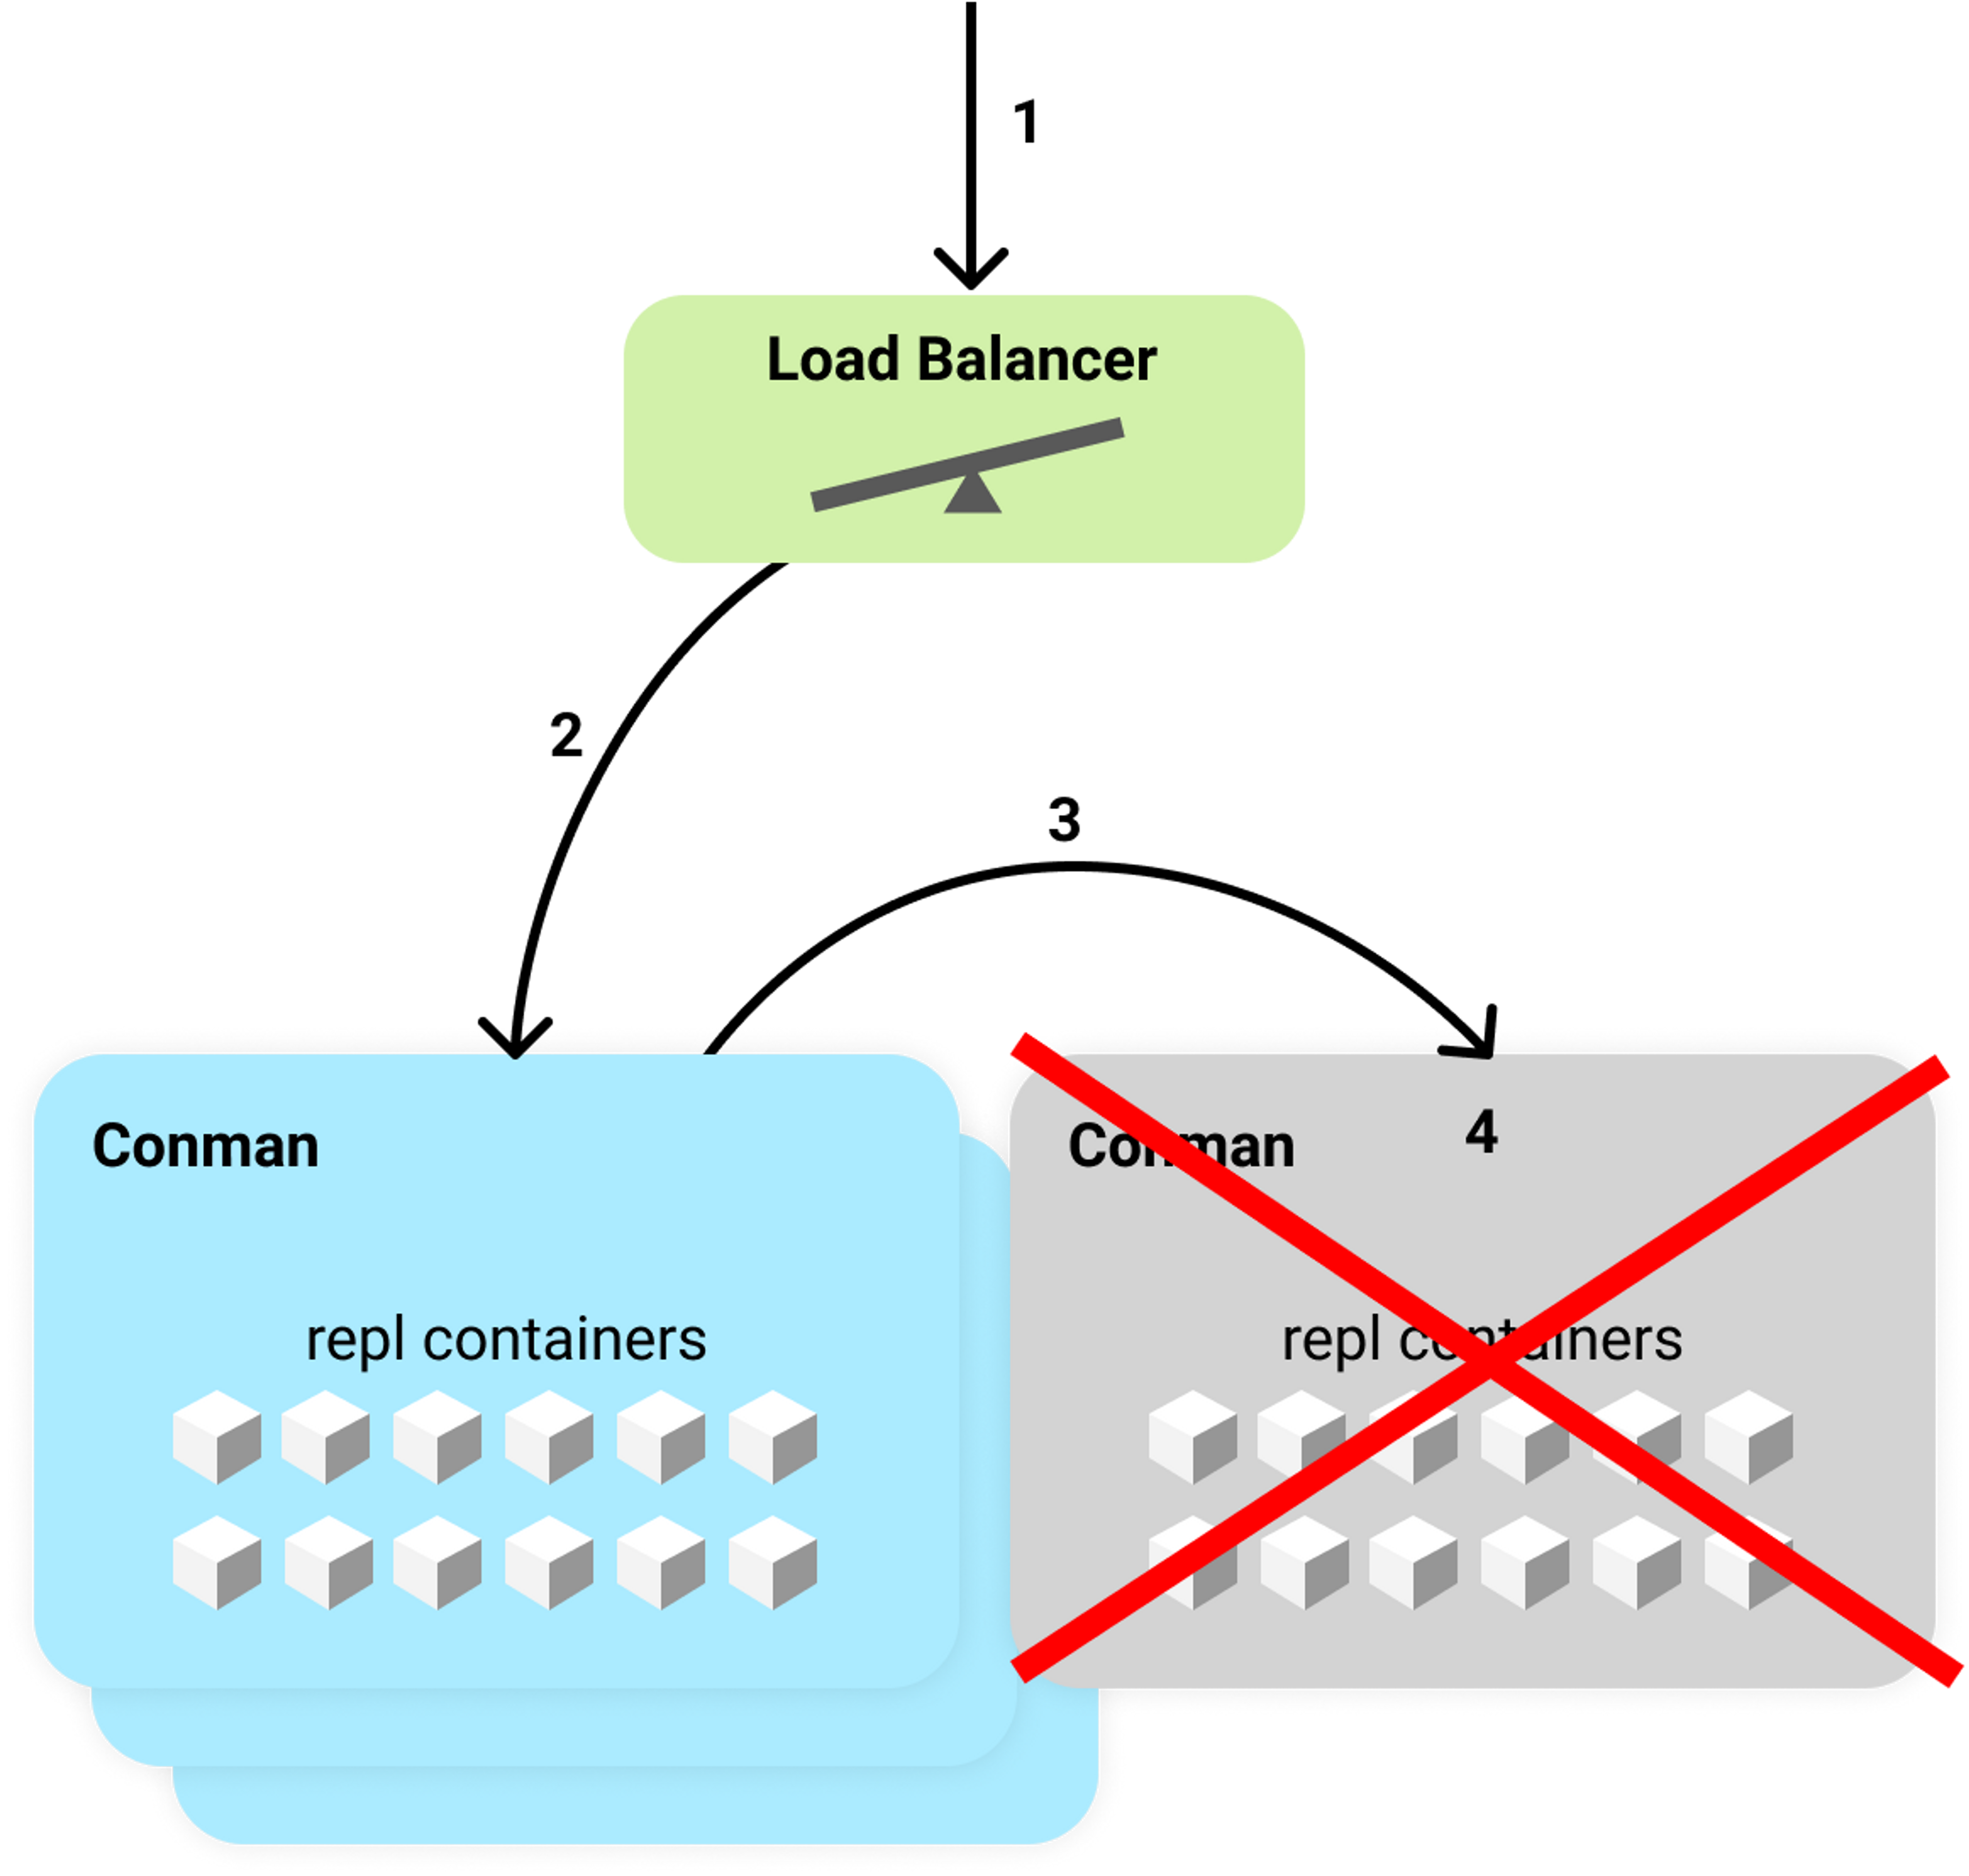
When you open a repl, the browser opens a websocket connection to a Docker container running on a preemptible VM. Each of the VMs run something we call conman, which is short for container manager.
We must ensure that there is only a single container per repl at anytime. The container is used to facilitate multiplayer features, so its important that every user in the repl connects to the same container.
When a machine that hosts these Docker containers shuts down, we have to wait for each container to be destroyed before they can be started again on some other machine. Since we use preemptible instances, this process happens frequently.
Below you can see the typical flow when trying to access a repl on a mid-shutdown instance.

- A user opens their repl which opens the IDE and attempts to connect to the backend evaluation server via a WebSocket.
- The request hits a load balancer which selects a conman instance to proxy to based on CPU usage.
- A healthy, living conman gets the request. Conman notices that the request is for a container that is living on a different conman and proxies the request there.
- Sadly this conman is shutting down and rejects the WebSocket connection!
Requests will continue to fail until either:
- The docker container is shut down and the repl container entry in the global store is removed.
- Conman finishes shutting down and is no longer accessible. In this case, the first conman will remove the old repl container entry and start a new container.
Slow Container Shutdowns
Our preemptible VMs are given 30 seconds to cleanly shutdown before they are forcibly terminated. After some investigation, we found that we rarely finished shutting down within those 30 seconds. This prompted us to dig further and instrument the machine shutdown routine.
After adding some more logging and metrics around machine shutdowns, it became clear that calls to docker kill were taking much longer than expected. docker kill usually took a few milliseconds to kill a repl container during normal operation, but we spent 20+ seconds killing 100-200 containers at the same time during shutdown.
Docker offers two ways to stop a container: docker stop and docker kill. Docker stop sends a SIGTERM signal to the container and gives it a grace period to gracefully shutdown. If the container doesn't shutdown within the grace period, the container is sent SIGKILL. We don't care about gracefully shutting down the container and would rather shut it down as quickly as possible. docker kill sends SIGKILL which should kill the container immediately. For some reason, the theory did not match reality, docker kill shouldn't be taking on the order of seconds to SIGKILL the container. There must be something else going on.
To dig into this, here is a script which will create 200 docker containers and time how long it takes to kill them at the same time.
#!/bin/bash

COUNT=200
echo "Starting $COUNT containers..."
for i in $(seq 1 $COUNT); do
    printf .
    docker run -d --name test-$i nginx > /dev/null 2>&1
done

echo -e "\nKilling $COUNT containers..."
time $(docker kill $(docker container ls -a --filter "name=test" --format "{{.ID}}") > /dev/null 2>&1)

echo -e "\nCleaning up..."
docker rm $(docker container ls -a --filter "name=test" --format "{{.ID}}") > /dev/null 2>&1
Running this on the same kind of VM we run in production, a GCE n1-highmem-4 instance, yields:
Starting 200 containers...
................................<trimmed>
Killing 200 containers...

real    0m37.732s
user    0m0.135s
sys     0m0.081s

Cleaning up...
This confirmed our suspicions that something is going in inside the Docker runtime which causes shutdowns to be so slow. Time to dig into Docker itself...
Docker daemon has an option to enable debug logging. These logs let us peak into what what's happening inside of dockerd and each entry has a timestamp so it might provide some insight into where all this time is being spent.
With debug logging enabled, let's rerun the script and look at dockerd's logs. This will output a lot of log messages since we are dealing with 200 container, so I've hand-selected portions of the logs that are of interest.
2020-12-04T04:30:53.084Z	dockerd	Calling GET /v1.40/containers/json?all=1&filters=%7B%22name%22%3A%7B%22test%22%3Atrue%7D%7D
2020-12-04T04:30:53.084Z	dockerd	Calling HEAD /_ping
2020-12-04T04:30:53.468Z	dockerd	Calling POST /v1.40/containers/33f7bdc9a123/kill?signal=KILL
2020-12-04T04:30:53.468Z	dockerd	Sending kill signal 9 to container 33f7bdc9a1239a3e1625ddb607a7d39ae00ea9f0fba84fc2cbca239d73c7b85c
2020-12-04T04:30:53.468Z	dockerd	Calling POST /v1.40/containers/2bfc4bf27ce9/kill?signal=KILL
2020-12-04T04:30:53.468Z	dockerd	Sending kill signal 9 to container 2bfc4bf27ce93b1cd690d010df329c505d51e0ae3e8d55c888b199ce0585056b
2020-12-04T04:30:53.468Z	dockerd	Calling POST /v1.40/containers/bef1570e5655/kill?signal=KILL
2020-12-04T04:30:53.468Z	dockerd	Sending kill signal 9 to container bef1570e5655f902cb262ab4cac4a873a27915639e96fe44a4381df9c11575d0
...
Here we can see the requests to kill each container, and that SIGKILLis sent almost immediately to each container.
Heres some log entries seen around 30 seconds after executing docker kill:
...
2020-12-04T04:31:32.308Z	dockerd	Releasing addresses for endpoint test-1's interface on network bridge
2020-12-04T04:31:32.308Z	dockerd	ReleaseAddress(LocalDefault/172.17.0.0/16, 172.17.0.2)
2020-12-04T04:31:32.308Z	dockerd	Released address PoolID:LocalDefault/172.17.0.0/16, Address:172.17.0.2 Sequence:App: ipam/default/data, ID: LocalDefault/172.17.0.0/16, DBIndex: 0x0, Bits: 65536, Unselected: 65529, Sequence: (0xfa000000, 1)->(0x0, 2046)->(0x1, 1)->end Curr:202
2020-12-04T04:31:32.308Z	dockerd	Releasing addresses for endpoint test-5's interface on network bridge
2020-12-04T04:31:32.308Z	dockerd	ReleaseAddress(LocalDefault/172.17.0.0/16, 172.17.0.6)
2020-12-04T04:31:32.308Z	dockerd	Released address PoolID:LocalDefault/172.17.0.0/16, Address:172.17.0.6 Sequence:App: ipam/default/data, ID: LocalDefault/172.17.0.0/16, DBIndex: 0x0, Bits: 65536, Unselected: 65530, Sequence: (0xda000000, 1)->(0x0, 2046)->(0x1, 1)->end Curr:202
2020-12-04T04:31:32.308Z	dockerd	Releasing addresses for endpoint test-3's interface on network bridge
2020-12-04T04:31:32.308Z	dockerd	ReleaseAddress(LocalDefault/172.17.0.0/16, 172.17.0.4)
2020-12-04T04:31:32.308Z	dockerd	Released address PoolID:LocalDefault/172.17.0.0/16, Address:172.17.0.4 Sequence:App: ipam/default/data, ID: LocalDefault/172.17.0.0/16, DBIndex: 0x0, Bits: 65536, Unselected: 65531, Sequence: (0xd8000000, 1)->(0x0, 2046)->(0x1, 1)->end Curr:202
2020-12-04T04:31:32.308Z	dockerd	Releasing addresses for endpoint test-2's interface on network bridge
2020-12-04T04:31:32.308Z	dockerd	ReleaseAddress(LocalDefault/172.17.0.0/16, 172.17.0.3)
2020-12-04T04:31:32.308Z	dockerd	Released address PoolID:LocalDefault/172.17.0.0/16, Address:172.17.0.3 Sequence:App: ipam/default/data, ID: LocalDefault/172.17.0.0/16, DBIndex: 0x0, Bits: 65536, Unselected: 65532, Sequence: (0xd0000000, 1)->(0x0, 2046)->(0x1, 1)->end Curr:202
These logs don't give us a full picture of everything dockerd is doing, but this makes it seem like dockerd might be spending a lot of time releasing network addresses.
At this point in my adventure, I decided it was time to start digging into docker engine's source code and build my own version of dockerd with some extra logging.
I started out by looking for the codepath that handles container kill requests. I added some extra log messages with timings of different spans and eventually I found out where all this time was being spent:
SIGKILL is sent to the container and then before responding to the HTTP request, the engine waits for the container to no longer be running (source)
<-container.Wait(context.Background(), containerpkg.WaitConditionNotRunning)
The container.Wait function returns a channel which receives the exit code and any error from the container. Unfortunately, to get the exit code and error, a lock on the interal container struct must be acquired. (source)
  ...

    go func() {
        select {
        case <-ctx.Done():
            // Context timeout or cancellation.
            resultC <- StateStatus{
                exitCode: -1,
                err:      ctx.Err(),
            }
            return
        case <-waitStop:
        case <-waitRemove:
        }

        s.Lock() // <-- Time is spent waiting here
        result := StateStatus{
            exitCode: s.ExitCode(),
            err:      s.Err(),
        }
        s.Unlock()

        resultC <- result
    }()

    return resultC

  ...
As it turns out, this container lock is held while cleaning up network resources and the s.Lock() above ends up waiting for a long time. This happens inside handleContainerExit. The container lock is held for the duration of the function. This function calls the container's Cleanup method which releases network resources.
So why does it take so long to cleanup network resources? The network resources are handled via netlink. Netlink is used to communicate between user and kernel-space processes and in this case is being used to communicate with a kernel-space process to configure network interfaces. Unfortunately, netlink works via a serial interface and all the operations to release the address of each container are bottlenecked by netlink.
Things started to feel a bit hopeless here. It didn't seem like there was anything we could do differently to escape waiting for network resources to be cleaned up. But, maybe we could bypass Docker altogether when killing containers.
As far as we are concerned, we want to kill the container but we don't need to wait for network resources to be cleaned up. The important thing is that the container will no longer produce any side effects. For example, we don't want the container to take anymore filesystem snapshots.
The solution I went with was to bypass docker by killing the container's pid directly. Conman records the pid of the container after it is started and then sends SIGKILL to the container when it becomes time to be killed. Since a container forms a pid namespace, when the container's pid terminates, all other processes in the container/pid namespace also terminate.
From pid_namespaces manual page:
If the "init" process of a PID namespace terminates, the kernel terminates all of the processes in the namespace via a SIGKILL signal.
Given this, we can be reasonably confident that after sending SIGKILL to the container, that the container no longer produces any side effects.
After this change was applied, control of repls would be relinquished under a few seconds during shutdown. This was a massive improvement over the 30+ seconds before and brought our session connection error rate down from ~3% to well under 0.5%. Additionally, the 99th percentile of session boot times dropped from ~2 minutes to ~15 seconds.
To recap, we identified that slow VM shutdowns were leading to stuck repls and poor user experience. After some investigation, we determined that Docker was taking 30+ seconds to kill all the containers on the VM. As a solution, we circumvent Docker and kill the containers ourselves. This has lead to fewer stuck repls and faster session boot times. We hope that this provides an even smoother experience on Replit!


